How to Graph Quadratic Equations
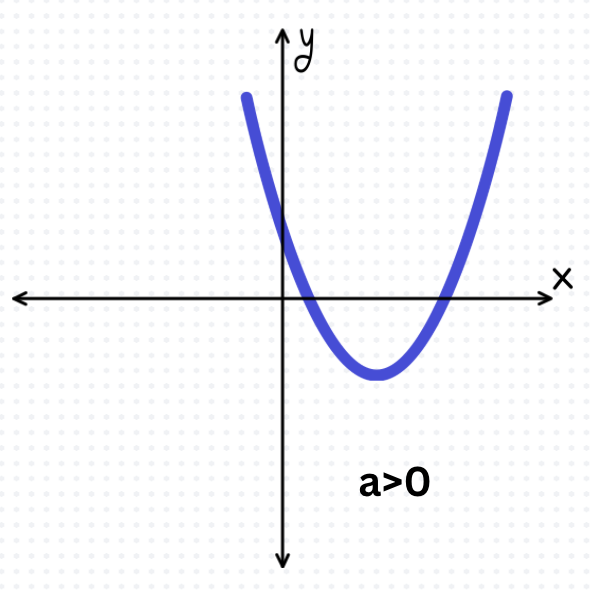
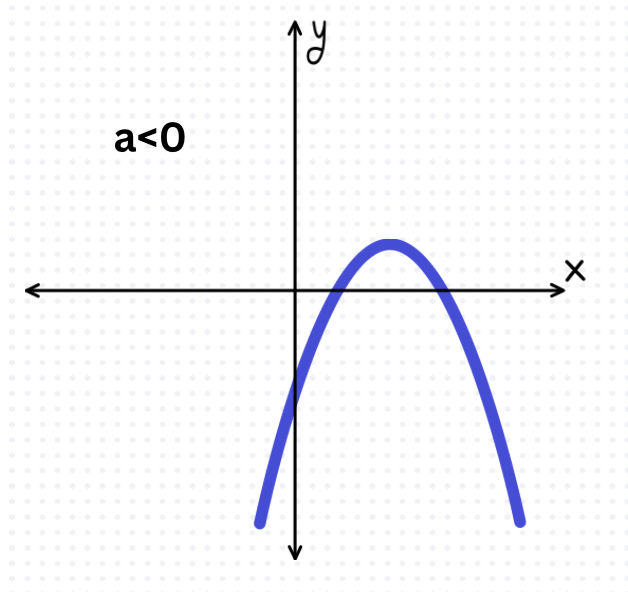
Graphing equations helps us visualize and understand the relationship between x and y. In this lesson, we will show how we can graph a quadratic equation given in standard form form \(y=ax^2 +bx +c\). If you are looking for how to graph equations of vertex form, click below.